Showing posts with label sage. Show all posts

Tuesday, April 24, 2018

SageMath GSoC 2018 Projects

We're happy to announce our list of Google Summer of Code projects for 2018! Thank you to everyone involved, all students, mentors and of course, Google! 


Sai Harsh Tondomker (David Coudert and Dima Pasechnik):

Addition of SPQR-tree to graph module

In this project, our goal is to extend the graph theory library in Sage by implementing functionality to find triconnected subgraphs, which will partition an undirected graph into 3-connected components and the construction of the corresponding SPQR-tree. These modules can later be used as pre-processing for several graph problems such as Hamiltonian Cycle, traveling salesman problem.


Meghana M Reddy (David Coudert and Dima Pasechnik):

Addition of SPQR-trees to the graph module of Sage Math

The aim of the project is to code the linear time algorithm for partitioning a graph into 3-connected components and constructing the corresponding SPQR-tree of the graph. Further, this algorithm can be used as a subroutine for several other graph problems such as recognition of chordless graphs, hamiltonian cycle etc.


Filip Ion (Johan Rosenkilde):

Databases and bounds of codes

The following proposal detail some possible improvements of the coding theory component of SageMath. We aim to build databases of precomputed bounds and optimal examples of linear codes for each choice of parameters below a maximum range.


Raghukul Raman (Travis Scrimshaw and Benjamin Hutz):

Rational Point on Varieties

This project aims at implementing basic algorithms for finding rational points on varieties. Classically algebraic variety is defined as the set of solutions of polynomial equations over a number field. A rational point of an algebraic variety is a solution of set of equations in the given field (rational field if not mentioned). Much of the number theory can be viewed as the study of rational point of algebraic varieties. Some of the great achievements of number theory amount to determining the rational points on particular curves. For example, Fermat’s last theorem is equivalent to the statement that for an integer n ≥ 3, the only rational point of the curve xn+yn=zn in P2 over Qare the obvious ones. Common variants of these question include determining the set of all points of V(K) of height up to some bound. The aim of this project is to implement some basic rational point finding algorithms (sieving modulo prime and enumeration) and extend these to product_projective_space scheme.


Dario Asprone (Dima Pasechnik)

Checking graph isomorphism using the Weisfeiler-Lehman algorithm

Currently SageMath checks for graph isomorphism through an internal package with a corresponding method, called isomorphic and contained in sage.groups.perm_gps.partn_ref.refinement_graphs. This method, in addition to being quite convoluted and without much documentation about its inner workings, was last updated in a significant manner in 2011.
The project aims at creating a new package which implements an efficient in practice heuristic method to check if two graphs are isomorphic, using one of the members of the Weisfeiler-Lehman (WL) algorithm hierarchy. An attempt was made in the past at the same task (but with a narrower scope, limited to only implementing the second order version of the WL algorithm), but the code was found to contain a bug and was never implemented/removed from the codebase (see Trac #10482).
To the best of my knowledge, this would be the first working open-source implementation of k-WL, for k > 1.


Friday, May 5, 2017

SageMath GSoC 2017 Projects

6 GSoC SageMath Projects

During the past couple of summers, SageMath successfully managed many Google Summer of Code projects. This year we are again happy to have six projects:


Implementing matroid classes and plotting improvements

(Zachary Gershkoff / Stefan van Zwam)
This project seeks to implement several common matroid classes in SageMath, along with algorithms for their display and relevant computations. The graphic matroid class in particular will be implemented with a representative graph with methods for Whitney switching and minor operations. This will be accompanied by improvements to the graph theory library, with methods relevant to matroids enabled to support multigraphs. Other modules for this project include improved plotting of rank 3 matroids to eliminate false colinearities, computation of a matroid's automorphism group using SageMath's group theory libraries, and faster minor testing based on an existing trac ticket.

Expanding the Functionality of Dynamical Systems

(Rebecca Lauren Miller / Paul Fili and Ben Hutz)

As a member of the sage-dynamics community, researchers have compiled a wishlist for algorithms and functionality they would like added. I would like to shorten the wish list for us.For my project I will be completing some desired additions to SAGE from the Sage Dynamics Wiki. I will implement Well’s Algorithm, strengthen the numerical precision in cannonical_height, as well as implement reduced_form for higher dimensions.

Improvement of Complex Dynamics in Sage

(Ben Barros / Adam Towsley and Ben Hutz)
There are three major things that I would like to implement to improve the functionality of Sage in the area Complex Dynamics. The details of the project are summarized in the following list:
  • Complex Dynamics Graphical package: Integrate or implement a complex dynamics software such as Mandel into Sage. This will be done by creating an optional package for Sage. If there is enough demand, the package may become a standard package for Sage at some point.
  • Spider Algorithm: The object of the Spider Algorithm is to construct polynomials with assigned combinatorics. For example, we may want to find a polynomial that has a periodic orbit of period 7. The Spider Algorithm provides a way for us to compute this polynomial efficiently. I plan to implement this algorithm into Sage.
  • Coercion: If you have a map defined over Q, you should be able to take the image of a point over C (i.e. somewhere you have a well-defined embedding) without having to use the command "change_ring()". Something similar works for polynomials in Sage but it does not work for morphisms/schemes.

Linear-time Implementation of Modular Decomposition of Undirected and Directed Graphs

(Lokesh Jain / Dima Pasechnik)
This project is aimed at providing linear time implementation for modular decomposition of graphs and digraphs. Modular decomposition is decomposition of graph into modules. A module is a subset of vertices and it is a generalization of connected component in graph. Let us take for example a module X. For any vertex v ∉ X it is either connected or not connected to every vertex of X. Another property of module is that a module can be subset of another module. There are various algorithms which have been published for modular decomposition of graphs. The focus in this project is on linear time complexity algorithms which can be practically implemented. The project further aims to use the modules developed for modular decomposition to implement other functionality like skew partitions. Skew partition is partition of graph into two sets of vertices such that induced graph formed by one set is disconnected and induced graph formed by other set is complement of the first. Modular decomposition is a very important concept in Graph Theory and it has a number of use cases. For instance it has been an important tool for solving optimization and combinatorics problems.

Modular Decomposition of graphs and digraphs

(Maria Ioanna Spyrakoy / Dima Pasechnik)
Modular decomposition of (di)graphs is a generalization of the concept of the decomposition of (di)graphs into connected components. Its current implementation in Sage relies on badly broken abandoned C code, and badly needs to be replaced by something that works and is not too slow. However, the only open-source implementations of some of these procedures are either in Java or in Perl, and thus aren't really useful for Sage.

Note: A attentive reader might notice the similarity between those projects. They will be split regarding the type of graph and be coordinated to not overlap but to augment each other.

Visualizing constructs in cluster algebras and quiver representations

(Bryan Wang / Travis Scrimshaw)
I aim to implement visualizations of several key constructs in cluster algebras and quiver representations. The first is Auslander-Reiten quivers, for at least the A_n and D_n cases. The second is labelled endomorphism quivers and mutations within a cluster category, focusing on the A_n case. The third is posets of down-mutations for the A_n case. These features will be useful not only for research purposes, but also as nice examples to play around with and learn from. Aside from these features, I am interested in implementing features for the Quantum Cluster Algebras project.

All the best for this summer, thank you to Google for making this possible, and sorry to all those candidates who didn't make it ...

Thursday, November 19, 2015

Monday, August 18, 2014

New combinatorial designs in Sage - by Nathann Cohen

This is a guest post by Nathann Cohen. 


New combinatorial designs in Sage

Below, these graphs are a decomposition of a $K_{13}$ (i.e. the complete graph on 13 points) into copies of $K_4$. Pick two vertices you like: they appear exactly once together in one of the $K_4$.


The second graph shows a decomposition of a $K_{4,4,4}$ (i.e. the complete multipartite graph on $4\times 3$ points) into copies of $K_3$. Pick two vertices you like from different groups: they appear exactly once together in one of the $K_4$.


Sage has gotten quite good at building such decompositions (a specific kind of combinatorial designs) when they exist. This post is about them.

The first object belongs to a family called Balanced Incomplete Block Designs (or $(n,k)$-BIBD), which are defined as "a collection $\mathcal S$ of sets, all of them with size $k$ (here $k=4$), such that any pair of points of a set $X$ with $|X|=n$ (here $n=13$) appears in exactly one set of $\mathcal S$".

The second belongs to the family of Transversal Designs (or $TD(k,n)$) which have a similar definition: consider a set $X$ containing $k$ groups (here $k=3$) of $n$ vertices (here $n=4$). A collection $\mathcal S$ of sets, each of which contains one point from each group, is a $TD(k,n)$ if any two points from different groups appear together in exactly one set of $\mathcal S$.

The main problem with combinatorial designs is to know where they exist. And that is not obvious. Sage does what it can on about that:

  • If you want it to build a $(14,4)$-BIBD, it will tell you that none exists.
  • If you want it to build a $(16,4)$-BIBD, it will tell you that one exists.
  • If you want it to build a $(51,6)$-BIBD, it will tell you that it just not know if there is one (and nobody knows better at the moment)
Examples here:

sage: designs.balanced_incomplete_block_design(14,4,existence=True)
False
sage: designs.balanced_incomplete_block_design(16,4,existence=True)
True
sage: designs.balanced_incomplete_block_design(51,6,existence=True)
Unknown

For a developer (and design lover), the game consists in teaching Sage how to build all combinatorial designs that appear in some research paper. For BIBD as well as for Transversal Designs, on which a LOT of sweat was spent these last months.

For Transversal designs the game is a bit different, as we know that a $TD(k-1,n)$ exists whenever a $TD(k,n)$ exists. Thus, the game consists in finding the largest integer $k_n$ such that a $TD(k_n,n)$ exists. This game is hardly new, and hardly straightforward: In the Handbook of Combinatorial Designs, one can find the table of such $k$ up to $n=10000$ (see here).

The good thing about Sage is that it does not just claim that such a design exists: it also builds it, and there is no better existence proof than that (it is very very quick to check that a combinatorial design is valid). The other good thing is that there is no common database for such data (the Handbook is not updated/printed every night), and that by teaching Sage all new designs found by researchers we build such a database. And it already contains designs that were not known when the Handbook was printed.

Finally, the other other good thing about Sage is that it will soon be able to tell you where those designs come from. Indeed, the most powerful results in the field of Transversal Designs are of the shape "If there exists a $TD(k_1,n_1)$, and a $TD(k_2,n_2)$, ..., and a $TD(k_c,n_c)$, then you can combine them all to obtain a $TD(k,n)$ with $k=k(k_1,...,k_c)$ and $n=n(n_1,...,n_c)$". And it is never very clear how to inverse these functions: if you want to build a $TD(k,n)$, which integers $k_1,...,k_c,n_1,...,n_c$ should you pick ?

Sage knows. It must know it, in order to build these designs anyway. And you can find that data inside. And soon, we will teach it to give you the bibliographical references of the papers in which you can find the right construction to produce the $TD(k,n)$ that you want. And we will provide the right parameters. And the world will be at peace.

A couple of things before we part:

  • Transversal Designs (TD), Orthogonal Arrays (OA), and Mutually Orthogonal Latin Squares (MOLS) are all equivalent objects.
  • We write a LOT of Transversal Designs code these days, so expect all this to improve very fast.
  • You can learn what Sage knows of combinatorial designs right here.
Finally, there are far too many combinatorial designs for one man to learn. If you love combinatorial designs, come join us: Vincent Delecroix, you, and I have code to write together. And if you know a related mathematical results that Sage ignores, come tell us: we could not have gone so far without the mathematical knowledge of Julian Abel. And Sage does not know everything yet.

Have fuuuuuuuuuuuuuuuuuuun !

Nathann

Tuesday, April 22, 2014

Sage GSoC 2014 Projects

This year, Sage is happy to announce that it will be running five Google Summer of Code projects. Welcome everyone to the Sage community and all the best to your summer filled with exiting projects ;-)

EDIT: lmonade related projects are listed here.

Nikhil Peter Raj (Volker Braun):

Improvements to the Sage Android App

This project aims to improve upon the existing app by improving both internal structure and external user experience, the former by replacing and redoing certain modules of the app (JSON Parsing, HTTP Requests and Exception Handling) and the latter by redesigning the UI so it conforms to the latest standards and specifications of Android Design, as well as adding extra features to the code input such as Syntax Highlighting and options to record and store custom inserts.

Amit Jamadagni (Miguel Angel Marco-Buzunariz)

Knot theory implementation

The project mainly deals with the implementation of various links, knots presentations and calculating various related invariants. The main aim of the project is to achieve: Conversion between different representations of Knots and Links to mention a few: Gauss code to Braid Word, Braid word to DT code, Gauss code to DT code. Implementation of various invariants: Alexander Polynomial, Conway Polynomial. Stiefert Matrix, Jones Polynomial

Jayant Apte (Stefan van Zwam)

Efficient class-specific membership checks, extensions and visualization 

First goal of this proposal is to implement efficient testing of a matroid for membership of various classes and to perform single element extensions of matroids that exploit the knowledge that a given matroid belongs to a certain class, to have lower complexity. We also propose implementation of visualization techniques and an application of matroid theory in form of enumeration of network codes for a multisource network coding problem which is one of the timely problems in information theory.

Simon Spicer (William Stein, Jonathan Bober)

Efficient exact analytic rank computation for elliptic curves in Sage

My project would be to implement functionality in Sage to compute the analytic rank of an elliptic curve exactly modulo standard conjectures, with better scaling than existing analytic rank estimation methods. This would necessitate both writing (significant amounts of) new Python and Cython code, as well as porting existing code into the Sage codebase.

Daniel Bell (Ivan Andrus)

iSage - improving the Sage iOS apps

There are several aspects of the Sage iOS apps that needs to be refreshed, improved or implemented. I propose to develop the ability to interact with several Sage services from the app, as well refresh the user interface for the app.


Wednesday, November 6, 2013

When will Sagemath Cloud hit 100,000 user accounts?

The Sagemath Cloud is an online environment for computational mathematics. Get an account, log in, and your web-browser transforms into almost everything you need to study algebra, calculus, numerics, statistics, number and game theory, (computational aspects of) physics, chemistry and all other quantitative sciences. It's built around all sorts of tools and utilities offered in a proper Linux environment. All files can be shared with collaborators and edited in real-time without stepping on each other's toes. Oh wait, there is also a LaTeX editor: given you know LaTeX, qualitative sciences are also covered ;-)

But beware, this posting will only talk about the very first: accounts. Below, I'll explain how I managed to create this page, the plot below and how I let it update automatically every hour - all done solely by SMC!

SMC accounts over time


Sagemath Cloud is very public about what is happening on its servers. This stats link gives you the raw data for the current overall load of the machines. What I did over the last weeks was the following: Every hour I've downloaded this stats json file, parsed it, accumulated some interesting numbers, and stored the processed data in a CSV file.

I did all this in SMC, because it allows you to run your own crontab files. Cron periodically goes through all kind of files to figure out if there is a job to do. Just enter a magical line in your own crontab file, and the given command is run whenever you tell it to do so. You do not have to be logged in!

In my case, it's like this:
First, edit your crontab file:
$ crontab -e
Then enter this line:
0 * * * * python $HOME/get.py

The $HOME is important, because you have to specify the full path where your script sits. (By the way, if you have to start something when the SMC server reboots, use the @reboot descriptor)

So, what is get.py doing? It uses the wonderful requests Python library to retrieve and parse the stats url and extracts some data. Then it appends a line to a CSV file.

Two minutes later (the crontab line starts with a "2"), another script is called which processes this CSV file. It reads the columns via pandas, properly parses the dates into time-series, and allows me to do all sorts of analysis, transformations and plots with it. For example, the plot shown above overlays the raw time series plot with OLS fits done by statsmodels for selected time ranges (where it looks "flat"). We can see the growth trends clearly! Even more important, so far the growth increases and hence we are watching the exponential growth phase as part of the beginning of the usual logistic growth.

The other plots on this statistics page show aggregated time-series data. For example, the plot for the number of concurrent connections is also increasing and reassures that SMC is scaling well.
Concurrent connections to SMC
On this statistics page, there are also a few "dynamic" fields in the HTML content. This is done by jinja2 in such a way, that the template "stats.tmpl" contains the HTML code and "mustache"-style variables. Jinja2 renders this template with some variables and that's it.

import jinja2 as j2
env = j2.Environment(loader=j2.FileSystemLoader("."))
stats = env.get_template("stats.tmpl")
data = {
        'date' : "%s UTC" % datetime.utcnow(),
        'recent_data' : totals.ix[-24:].to_html()
}
with open("stats.html", "wb") as output:
    output.write(stats.render(**data))

The last step of the script is to actually publish the files to the webserver. That's rather straight forward. First and only once, create ssh keys via ssh-keygen without a password and then use ssh-copy-id -i ~/.ssh/id_dsa.pub name@server to copy over your keys. Subsequent ssh connections will be established without any questions asked, because the remote server knows your identity. I'm using scp to copy the files: scp *.png stats.html name@remote-server:~/target/dir/

Last but not least, when will SMC hit the 100,000 user mark? In less than 6 days the 10,000 mark should be crossed and I hope the trend continues into the upward direction.

Monday, May 27, 2013

Sage announces 3 GSoC projects

Sage is pleased to announce three Google Summer of Code projects for 2013. They focus on speed improvements of symbolic functions, simplifying the distribution and installation procedure on Debian/Linux and ubiquitous accessibility of Sage on the Android platform.


Mathematical Functions Library

Eviatar Bach –  University of British Columbia in Vancouver, Canada
(Mentor: Flavia Stan, Backup: Burcin Erocal)


Sage interfaces with multiple third-party libraries, such as MPFR, GSL, GP/PARI, mpmath, and Maxima, for numerical evaluation of special functions. There are significant discrepancies between these backends in the performance for numerical approximations of the same expression. An initial benchmark reveals, for example, that calculating spherical_bessel_J(1, 5.2) with SciPy is over 100 times faster than with Maxima.

The project has the following goals:
  1. develop a benchmark framework to determine which backend should be used by default to evaluate a special function over a specific domain,
  2. create symbolic wrappers for all the special functions that can be evaluated numerically by a package included in Sage,
  3. create a data structure for generalized hypergeometric functions and extend the symbolic wrappers to obtain representations in terms of generalized hypergeometric functions when possible,
  4. implement closure properties for holonomic functions as a next step to improve the symbolic processing of special functions in Sage.


Overall improvement of the Sage Android application

Rasmi Elasmar
(Mentor: Volker Braun, Backup: Harald Schilly)


Although there are already some existing efforts, Sage is still not easily accessible from the Android platform. The Sage Cell client/server infrastructure is an already existing step towards running Sage on a server and communicating back the results. The aim of this proposal is to fix, improve and update the Sage Android application to include new features and functionality, as well as an improved interface for simpler and improved usability. Android's new "Holo" style, sharing of calculations and results, and much more waits to be realized on Android for Sage.


Get Sage ready for Linux distributions

Felix Salfelder – Goethe Universität, Frankfurt, Germany
(Mentor: Tobias Hansen, Julien Puydt, Jeroen Demeyer & John Palmieri )

The aim of this project is to detach the build process of Sage ("the software") from Sage ("the distribution"). The goal is a build system that works within the context of Sage as well as for any GNU/Linux distribution that ships the dependencies for Sage. Distributions that already ship Sage packages or plan to do so are Fedora and Debian. This project is an important step towards making Sage packages in GNU/Linux distributions feasible.


Sage warmly welcomes all three new students and wishes them all the best to learn something new and make an impact in Sage's future developments!

Monday, April 8, 2013

Sage part of Google's Summer of Code 2013

Good News, like last year Sage is once again part of Google's Summer of Code. This means, until April 22 at 19:00 UTC students can submit their applications and mentors will review them and do the matching.

Please share this with prospective students or think about being a mentor this year!

links:

Tuesday, March 19, 2013

Sage 5.8

Sage 5.8 has been released, download it here.

Also, the documentation page has been updated to reflect the new thematic tutorials. I highly recommend to browse through all those topics to learn more about Sage's ever increasing scope.

Friday, November 30, 2012

Mathematica 9's R integration vs. Rpy2


Some notes about "What's new in Mathematica 9: Builtin R Integration"
To understand what's going on, please open the example: Hierarchical Clustering.

This posting is basically about how to integrate R via Rpy2 in Python and hence also in Sage.

First thing you should notice is the clash of two parallel worlds. MMA's "RSet" command converts and sets the variable y in the scope of R. That's nice, but wouldn't it be much easier, to just have a local variable for that? Second of all, the function definitions inside strings - filled with escaped quotes - is also not that great. Isn't there are better quoting available?

What I want to do is to accomplish something similar with Rpy2. So yes, there are also equivalents to this RSet function, and you can also evaluate arbitrary R code inside strings (Python has triple-quoting to avoid escaping quotes). But that's not everything. You can import R packages [from rpy2.robjects.packages import importr] and bind them to local variables and have, for example, tab-completion on them. R Functions can be referenced directly, data-sets can be exchanged with implicit converters (e.g. numpy's ndarray -> R's Matrix), etc.

You can see the final output and code here: https://gist.github.com/4176508

Besides the usual import/from stuff common in Python, I start by creating a random matrix with Numpy:


mdata = np.random.randn(10, 5)

Enable autmatic conversion between Numpy and R:


from rpy2.robjects import numpy2ri
numpy2ri.activate()


Print the matrix using R's print:

rprint = robj.globalenv.get("print")
rprint(mdata)

            [,1]        [,2]        [,3]         [,4]        [,5]
 [1,]  2.1844065 -1.05401295  1.18316261 -0.356338229  1.55031790
 [2,]  1.2476473  0.89507075 -0.14576584  0.006899727  0.01350773
 [3,] -1.6416017 -0.28180113  0.02784612  1.199042583  0.01272994
 [4,]  1.8645490  0.30993270  0.18107913  0.131505590  0.57083588
 [5,]  1.2397427  0.73639680 -0.42883124 -0.436741492  0.43644592
 [6,] -0.1980955 -0.04463804 -0.11217381  1.768415923 -1.82884840
 [7,]  0.2943145  2.12648235  0.21068166  1.718289719  0.15711455
 [8,]  0.2453526  0.64922040  1.80518277  0.086208024  1.18789962
 [9,]  0.8229507  0.56227084 -1.72153433 -1.511514201  1.04610492
[10,]  0.1430900  0.03371198 -0.58992825  1.023002088 -1.47153121


... and just for fun, R'summary, printed with Python's print function:

print r.summary(mdata)

         V1                V2                 V3                 V4       
 Min.   :-1.6416   Min.   :-1.05401   Min.   :-1.72153   Min.   :-1.5115
 1st Qu.: 0.1687   1st Qu.:-0.02505   1st Qu.:-0.35806   1st Qu.:-0.2655
 Median : 0.5586   Median : 0.43610   Median :-0.04216   Median : 0.1089
 Mean   : 0.6202   Mean   : 0.39326   Mean   : 0.04097   Mean   : 0.3629
 3rd Qu.: 1.2457   3rd Qu.: 0.71460   3rd Qu.: 0.20328   3rd Qu.: 1.1550
 Max.   : 2.1844   Max.   : 2.12648   Max.   : 1.80518   Max.   : 1.7684
       V5        
 Min.   :-1.82885
 1st Qu.: 0.01292
 Median : 0.29678
 Mean   : 0.16746
 3rd Qu.: 0.92729
 Max.   : 1.55032  


... now applying the labels. This time, I show how to execute R code directly, hence injecting the variable "y" in R's global namespace, too:

from rpy2 import robjects as robj
robj.globalenv['y'] = mdata

r("""
dimnames(y) <- b="b">
list(paste("g", 1:10, sep=""),
                    paste("t", 1:5,  sep=""))
y
""")


Compare this to the way you have to do this in MMA9!

--- EDIT
Below is a way how the same is accomplished in Python. The paste command is replaced by Python's list comprehension, the list command is from R and mdata is converted to an R object to be able to do slot assignments.


mdata = numpy2ri.numpy2ri(mdata)
import rpy2.rinterface as ri
descr = ri.baseenv["list"](
         ri.StrSexpVector(['g%s'%_ for _ in range(10)]),
         ri.StrSexpVector(['t%s'%_ for _ in range(5)]))
mdata.do_slot_assign("dimnames", descr)


The first example is certainly more pleaseant, but once you would create some neat aliases for the R functions (e.g. list = ri.baseenv["list"]; strv = ri.StrSexpVector; ...), working in Python shouldn't be hard, too.
--- END EDIT

Calculating the correlation and distance matrix. Notice, that dots in R's functions, like the as.dist(), are converted to underscores in Python. Those dots are just like normal letters in the identifier name, nothing further.

stats = importr("stats")

corrm = r.cor(r.t(mdata), method="spearman")
# no idea how to do 1-matrix automagically
robj.globalenv['corrm'] = corrm
distm = stats.as_dist(r("1-corrm"))


rprint(corrm)
rprint(distm)


      [,1] [,2] [,3] [,4] [,5] [,6] [,7] [,8] [,9] [,10]
 [1,]  1.0 -0.3  0.1  0.5 -0.2  0.9  0.8  0.6  0.3   0.2
 [2,] -0.3  1.0  0.6  0.3  0.7 -0.4  0.0  0.1  0.2  -0.5
 [3,]  0.1  0.6  1.0 -0.1 -0.1 -0.3 -0.1  0.7  0.6  -0.9
 [4,]  0.5  0.3 -0.1  1.0  0.7  0.6  0.7 -0.1 -0.3   0.3
 [5,] -0.2  0.7 -0.1  0.7  1.0  0.0  0.3 -0.4 -0.3   0.2
 [6,]  0.9 -0.4 -0.3  0.6  0.0  1.0  0.9  0.3  0.1   0.6
 [7,]  0.8  0.0 -0.1  0.7  0.3  0.9  1.0  0.4  0.3   0.5
 [8,]  0.6  0.1  0.7 -0.1 -0.4  0.3  0.4  1.0  0.9  -0.4
 [9,]  0.3  0.2  0.6 -0.3 -0.3  0.1  0.3  0.9  1.0  -0.3
[10,]  0.2 -0.5 -0.9  0.3  0.2  0.6  0.5 -0.4 -0.3   1.0


     1   2   3   4   5   6   7   8   9
2  1.3                               
3  0.9 0.4                           
4  0.5 0.7 1.1                       
5  1.2 0.3 1.1 0.3                   
6  0.1 1.4 1.3 0.4 1.0               
7  0.2 1.0 1.1 0.3 0.7 0.1           
8  0.4 0.9 0.3 1.1 1.4 0.7 0.6       
9  0.7 0.8 0.4 1.3 1.3 0.9 0.7 0.1   
10 0.8 1.5 1.9 0.7 0.8 0.4 0.5 1.4 1.3


The clustering happens below (note: I had to execute the "NULL" in the r context, because it seems that Python's "None" isn't converted)

hr = stats.hclust(distm, method = "complete", members = r("NULL"))

Plotting is straightforward too. To plot to a device besides X11, one has to be a bit more specific. The documentation is full of examples. Notice, the only special part is the mfrow=r.c(1,2). 

Looking at Wolfram's blogpost, I really don't want to understand what MMA's "getRPlot[...]" calling "mathematicaRPlotWrapper" does.

grdevices = importr('grDevices')
grdevices.png(file="mma9rpy2.png", width=512, height=300)
try:
  r.par(mfrow = r.c(1,2))
  r.plot(hr, hang = 0.1)
  r.plot(hr, hang = -0.1)
finally:
  grdevices.dev_off()

grdevices.png(file="mma9rpy2-2.png", width = 512, height = 512)
try:
  r.heatmap(mdata)
finally:
  grdevices.dev_off()


Final results:


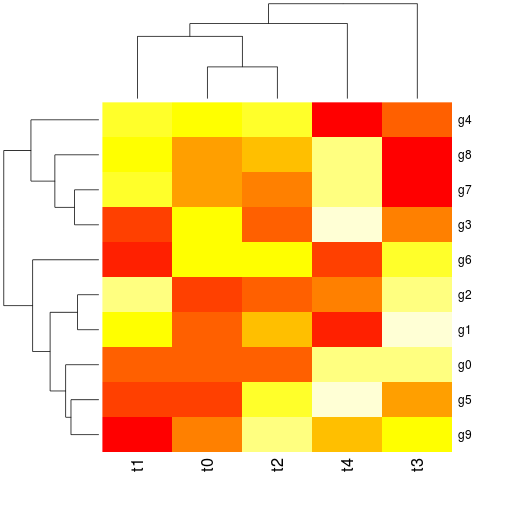
... and a heatmap plot:

Final note, yes I know there is some fuzz at the bottom of the image with the dendrogram. I don't know why. Maybe someone can fix this ... and yes, that's possible, because all of this is fully open-sourced :-) 

td;dr: https://gist.github.com/4176508


Friday, November 23, 2012

Sage 5.4.1 Released

Sage 5.4.1 was released on 15 November 2012. 

It is available in source and binary form from:
Sage (http://www.sagemath.org/) is developed by volunteers and combines over 90 open source packages. For instructions about installing Sage, see

The following page lists the platforms on which Sage should work:
If you have any questions and/or problems, please report them to any of these Google groups:
You can also drop by in #sagemath on freenode or post your questions at http://ask.sagemath.org/

The following 15 people contributed to this release. Of those, 2 made their first contribution to Sage:

  - Aly Deines
  - Benjamin Hutz [first contribution]
  - Burcin Erocal
  - David Loeffler
  - Dmitrii Pasechnik
  - Jeroen Demeyer
  - John Palmieri
  - Karl-Dieter Crisman
  - Kenneth Smith
  - Paul Zimmermann
  - Punarbasu Purkayastha
  - Sarah Chisholm
  - Sebastien Gouezel [first contribution]
  - Travis Scrimshaw
  - Volker Braun

* Release manager: Jeroen Demeyer.

* We closed 13 tickets in this release. For details, see

  http://boxen.math.washington.edu/home/release/sage-5.4.1/tickets.html

Closed tickets:

#13309: Build Sage on OS X Mountain Lion [Reviewed by Dmitrii Pasechnik]

Merged in sage-5.4.1.rc0:

#6367: Karl-Dieter Crisman, Kenneth Smith: polygon2d -- several issues: typo in docs, shouldn't have been renamed [Reviewed by Volker Braun]
#10803: Paul Zimmermann: critical bug in real_roots [Reviewed by Jeroen Demeyer]
#12753: Benjamin Hutz: is_PrimeField import error [Reviewed by David Loeffler]
#12859: Aly Deines: quaternion algebra 'ramified at one prime' [Reviewed by Sarah Chisholm]
#13382: Dmitrii Pasechnik: build docs for SymmetricGroupRepresentation(s) [Reviewed by Volker Braun, Travis Scrimshaw]
#13533: Jeroen Demeyer: Remove "optional - gcc" from doctests [Reviewed
by Karl-Dieter Crisman, John Palmieri]
#13541: John Palmieri: update scipy to 0.11.0 [Reviewed by Dmitrii Pasechnik]
#13598: John Palmieri: 'x' should be defined when using 'sage -c' [Reviewed by Punarbasu Purkayastha]
#13632: Sebastien Gouezel: Fix latex display of arguments of symbolic functions [Reviewed by Burcin Erocal] 

Merged in sage-5.4.1.rc1:

#13407: Jeroen Demeyer: Move sage-make_relative to sage-location [Reviewed by Dmitrii Pasechnik]
#13452: Jeroen Demeyer: Refactor sage-location [Reviewed by Dmitrii Pasechnik]
#13689: Jeroen Demeyer: Fix upgrading from relocated Sage with GCC [Reviewed by John Palmieri]

Thursday, November 15, 2012

Sage 5.4 released


I'm glad to blog (and "reshare) that Sage 5.4 is available now.

Some random picks from the release notes:

  • notebook internationalization
  • 4ti2 interface
  • MathJax  instead of jsMath
  • Bijection between Rigged Configurations and Crystal Paths
  • new features in group algebra category
  • non commutative symmetric functions
  • Update Cremona's table of elliptic curves to 270000
  • Plancherel measure of an individual partition

... and much more besides even more bugfixes :-)

http://sagemath.org/download.html

And I suggest you to follow Sage at Google+ to stay in the loop.

New Mirror: Universidade de São Paulo

Sage just got a second mirror in South America, at the Universidade de São Paulo: http://linorg.usp.br/sage. Now, there are two in Brazil and no one in another country, but still better than just one SPOF.

Monday, April 30, 2012

Sage goes GSoC

This year Sage is part of the GSoC program for the first year. This is an exciting new opportunity to get new contributors on board and to aim for new features. We got nearly 60 project proposals, of which about 8 or more were really excellent ones. We got 3 slots to fill and therefore it was a really hard decision which projects to pick.  We are curious how this will turn out during the summer.


The projects are:

The actual work starts on May 21st and all three students will give regular updates through their blogs or by posting to the mailing list to keep others in the loop what they are doing. All regular developers are invited to give them feedback and help them if they encounter any problems.

Saturday, March 6, 2010

Anchors in Sage Notebooks

If you have a lengthy Sage Notebook and you want to quickly jump to a certain header or paragraph as a reference, use HTML anchors. They work like follows:
  1. An <a name="anchorname"></a> tag must be inserted at the position you want to jump to.
  2. Reference it via <a href="#anchorname">some text</a>.
After that, you can jump to the marked position just by clicking on the some text link.

To insert rich text and HTML, use the rich text editor accessible via <shift>+<click on blue insert bar>. There is an "HTML" icon. Alternatively, you can use the html() function:
i.e. html('<a name="test"></a>') ...

Thursday, January 21, 2010

Compiling Sage on my Atom N270 Netbook

Here are some notes to myself regarding compiling Sage on my HP Mini 2140 with an Atom N270 CPU. I'm running Linux Ubuntu 9.10. This successfully compiles Sage 4.3 and 4.3.1 and might also work for later version.

Download


# using aria2, first get aria2
$ 
sudo apt-get install aria2
# go to a local directory and just use the .metalink link
$
aria2c http://server/path/sage-x.y.z.tar.metalink


# note, that aria2c doesn't stop when it has finished.
# it will start seeding the file to others via bittorrent.
# You can terminate this by hitting Ctrl-C


####

# or download via http/ftp from the download page

Verify

# If you think your download might have been corrupted, verify it:
$ 
aria2c -V http://server/path/sage-x.y.z.tar.metalink


Extract


# any local directory is fine
$ tar xf sage-x.y.z.tar


Prerequisites

# You need some tools to compile Sage:
$ sudo apt-get install build-essential m4\
readline libreadline-dev gfortran texlive
# read more: Installation Guide

Setup Build Environment

$ cd sage-x.y.z

# get rid of some environment variables, unless
# you know what you do (i.e. ccache, ...)
$
unset CC
$
unset CXX

# see README.txt if you need this
$
export SAGE_FAT_BINARY="yes"

# if you have gfortran library problems
# find your correct paths via $ locate gfortran
# setting these variables is necessary on Ubuntu 9.10
$
export SAGE_FORTRAN=/usr/bin/gfortran
$ export SAGE_FORTRAN_LIB=/usr/lib/libgfortran.so.3

# note: do not start over compilation if that problem happens,
# you have to remove and clean up everything first

# there are two cores in the CPU
# use both of them in parallel!
$
export MAKE="make -j2"

Start Compilation

# in a resource friendly mode
$ ionice -c 3 nice make

Testing and Packaging


If compilation didn't end with an error (otherwise: search, sage-support and sage-devel or irc chat)

# Test the entire beast (2 for 2 CPU cores):
$ ./sage -tp 2 devel/sage-main
# or
$ ./sage -testall
# once again, please report problems

If you want to build a
binary distribution, upload it to us at sagemath.org or send it to a friend with a similar machine+system:


$ ./sage -bdist x.y.z-LinuxVersion;

On systems like Ubuntu, you can shrink the resulting archive much smaller using lzma compression. "trans-compress" it via:


$ zcat sage-x.y.z-...tar.gz | lzma -zv > sage-x.y.z-...tar.lzma

and to extract the tar.lzma later:

$ tar --lzma -xvf sage-x.y.z...tar.lzma

Links

Sunday, November 29, 2009

Maintaining a Mirror Network

Here are some notes about maintaining a mirror network. I'm talking about the Sage software, which is a nice open source mathematics program. Besides the source, there are many prebuilt binaries for various platforms. In total, for each release once a month, there have to move about 14GB in 27 files to 18 mirror websites on all continents of the world. It's important to have nearby mirrors, because the network connectivity might be weak in some areas. In Nov. 2009, the virtual box image for windows alone generated about 1.5 TB of traffic - all other binaries and source combined probably also 1.5 TB. Therefore, the mirror networks net efficiency is approximately a tenfold increases of the outgoing data volume.


To ensure that only those mirrors which are online and up-to-date are listed on the website, a small Python script checks a time-stamp file with a content-specific checksum. Only if it is correct and retrievable, the mirror is included. This check happens every 10 minutes, using Linux's cron mechanism.


Recently I enhanced this to visualize how the mirrors perform over time. This is especially interesting when a new release is mirrored out into the world. To see how this looks like, here is the graphic for the Sage 4.2.1 rollout:


Time starts at the bottom, you see it's around 14:00 GMT on Nov. 17th. The first working mirror is "UW", which is the master. The master mirror is excluded, once there is at least another one in North America online - as you can see that's SFU and Boston (Harvard). You can also see that it takes more than one day to sync with the mirrors. Besides that the transfer takes its time, they are probably scheduled to start sync only once a day, the master mirror rejects too many simultaneous connections, too many users download directly from the main server or there is simply some other timeout! Why are there two breaks? Well, not all binaries are ready at the same time and the timestamp is for the whole mirror, so that you do not access an outdated mirror. The broken line of Yandex is also a bit odd, but that's because they have multiple servers and seem to switch between. 


How does it look right now? Here is the website for the mirror log visualization. There is also a link to how it looked last week.


Beyond just retrieving a file through http or ftp you can use a metalink file. Through a client it enables downloading from all available mirrors simultaneously and the client selects a few but fastest mirrors automatically. It also checks consistency and downloads are resumable. That's the ideal solution if you have a weaker connection and need to stop a huge transfer for some time or it is just flaky. Hint: use aria2 or DownThemAll. 


Ok, at last some words about hosting a mirror. Two things are important: sync often to avoid wasting time when you could transfer data, but only sync once at a time ;) I've written how i did set up a mirror (the Boston one) in a MirrorNetwork wiki page.


In case the main website is down, you can find a mirror here.


Thank's to all our mirror hosters! Without them Sage would probably never reach their users and new mirrors are always welcome, especially in southern asia!