Some notes about "What's new in Mathematica 9: Builtin R Integration"
To understand what's going on, please open the example: Hierarchical Clustering.
This posting is basically about how to integrate R via Rpy2 in Python and hence also in Sage.
First thing you should notice is the clash of two parallel worlds. MMA's "RSet" command converts and sets the variable y in the scope of R. That's nice, but wouldn't it be much easier, to just have a local variable for that? Second of all, the function definitions inside strings - filled with escaped quotes - is also not that great. Isn't there are better quoting available?
What I want to do is to accomplish something similar with Rpy2. So yes, there are also equivalents to this RSet function, and you can also evaluate arbitrary R code inside strings (Python has triple-quoting to avoid escaping quotes). But that's not everything. You can import R packages [from rpy2.robjects.packages import importr] and bind them to local variables and have, for example, tab-completion on them. R Functions can be referenced directly, data-sets can be exchanged with implicit converters (e.g. numpy's ndarray -> R's Matrix), etc.
You can see the final output and code here: https://gist.github.com/4176508
Besides the usual import/from stuff common in Python, I start by creating a random matrix with Numpy:
mdata = np.random.randn(10, 5)
Enable autmatic conversion between Numpy and R:
from rpy2.robjects import numpy2ri
numpy2ri.activate()
Print the matrix using R's print:
rprint = robj.globalenv.get("print")
rprint(mdata)
[,1] [,2] [,3] [,4] [,5]
[1,] 2.1844065 -1.05401295 1.18316261 -0.356338229 1.55031790
[2,] 1.2476473 0.89507075 -0.14576584 0.006899727 0.01350773
[3,] -1.6416017 -0.28180113 0.02784612 1.199042583 0.01272994
[4,] 1.8645490 0.30993270 0.18107913 0.131505590 0.57083588
[5,] 1.2397427 0.73639680 -0.42883124 -0.436741492 0.43644592
[6,] -0.1980955 -0.04463804 -0.11217381 1.768415923 -1.82884840
[7,] 0.2943145 2.12648235 0.21068166 1.718289719 0.15711455
[8,] 0.2453526 0.64922040 1.80518277 0.086208024 1.18789962
[9,] 0.8229507 0.56227084 -1.72153433 -1.511514201 1.04610492
[10,] 0.1430900 0.03371198 -0.58992825 1.023002088 -1.47153121
... and just for fun, R'summary, printed with Python's print function:
print r.summary(mdata)
V1 V2 V3 V4
Min. :-1.6416 Min. :-1.05401 Min. :-1.72153 Min. :-1.5115
1st Qu.: 0.1687 1st Qu.:-0.02505 1st Qu.:-0.35806 1st Qu.:-0.2655
Median : 0.5586 Median : 0.43610 Median :-0.04216 Median : 0.1089
Mean : 0.6202 Mean : 0.39326 Mean : 0.04097 Mean : 0.3629
3rd Qu.: 1.2457 3rd Qu.: 0.71460 3rd Qu.: 0.20328 3rd Qu.: 1.1550
Max. : 2.1844 Max. : 2.12648 Max. : 1.80518 Max. : 1.7684
V5
Min. :-1.82885
1st Qu.: 0.01292
Median : 0.29678
Mean : 0.16746
3rd Qu.: 0.92729
Max. : 1.55032
... now applying the labels. This time, I show how to execute R code directly, hence injecting the variable "y" in R's global namespace, too:
from rpy2 import robjects as robj
robj.globalenv['y'] = mdata
r("""
dimnames(y) <- b="b">list(paste("g", 1:10, sep=""),
paste("t", 1:5, sep=""))
y
""")
Compare this to the way you have to do this in MMA9!
--- EDIT
Below is a way how the same is accomplished in Python. The paste command is replaced by Python's list comprehension, the list command is from R and mdata is converted to an R object to be able to do slot assignments.
mdata = numpy2ri.numpy2ri(mdata)
import rpy2.rinterface as ri
descr = ri.baseenv["list"](
ri.StrSexpVector(['g%s'%_ for _ in range(10)]),
ri.StrSexpVector(['t%s'%_ for _ in range(5)]))
mdata.do_slot_assign("dimnames", descr)
The first example is certainly more pleaseant, but once you would create some neat aliases for the R functions (e.g. list = ri.baseenv["list"]; strv = ri.StrSexpVector; ...), working in Python shouldn't be hard, too.
--- END EDIT
Calculating the correlation and distance matrix. Notice, that dots in R's functions, like the as.dist(), are converted to underscores in Python. Those dots are just like normal letters in the identifier name, nothing further.
stats = importr("stats")
corrm = r.cor(r.t(mdata), method="spearman")
# no idea how to do 1-matrix automagically
robj.globalenv['corrm'] = corrm
distm = stats.as_dist(r("1-corrm"))
rprint(corrm)
rprint(distm)
[,1] [,2] [,3] [,4] [,5] [,6] [,7] [,8] [,9] [,10]
[1,] 1.0 -0.3 0.1 0.5 -0.2 0.9 0.8 0.6 0.3 0.2
[2,] -0.3 1.0 0.6 0.3 0.7 -0.4 0.0 0.1 0.2 -0.5
[3,] 0.1 0.6 1.0 -0.1 -0.1 -0.3 -0.1 0.7 0.6 -0.9
[4,] 0.5 0.3 -0.1 1.0 0.7 0.6 0.7 -0.1 -0.3 0.3
[5,] -0.2 0.7 -0.1 0.7 1.0 0.0 0.3 -0.4 -0.3 0.2
[6,] 0.9 -0.4 -0.3 0.6 0.0 1.0 0.9 0.3 0.1 0.6
[7,] 0.8 0.0 -0.1 0.7 0.3 0.9 1.0 0.4 0.3 0.5
[8,] 0.6 0.1 0.7 -0.1 -0.4 0.3 0.4 1.0 0.9 -0.4
[9,] 0.3 0.2 0.6 -0.3 -0.3 0.1 0.3 0.9 1.0 -0.3
[10,] 0.2 -0.5 -0.9 0.3 0.2 0.6 0.5 -0.4 -0.3 1.0
1 2 3 4 5 6 7 8 9
2 1.3
3 0.9 0.4
4 0.5 0.7 1.1
5 1.2 0.3 1.1 0.3
6 0.1 1.4 1.3 0.4 1.0
7 0.2 1.0 1.1 0.3 0.7 0.1
8 0.4 0.9 0.3 1.1 1.4 0.7 0.6
9 0.7 0.8 0.4 1.3 1.3 0.9 0.7 0.1
10 0.8 1.5 1.9 0.7 0.8 0.4 0.5 1.4 1.3
The clustering happens below (note: I had to execute the "NULL" in the r context, because it seems that Python's "None" isn't converted)
hr = stats.hclust(distm, method = "complete", members = r("NULL"))
Plotting is straightforward too. To plot to a device besides X11, one has to be a bit more specific. The documentation is full of examples. Notice, the only special part is the mfrow=r.c(1,2).
Looking at Wolfram's blogpost, I really don't want to understand what MMA's "getRPlot[...]" calling "mathematicaRPlotWrapper" does.
grdevices = importr('grDevices')
grdevices.png(file="mma9rpy2.png", width=512, height=300)
try:
r.par(mfrow = r.c(1,2))
r.plot(hr, hang = 0.1)
r.plot(hr, hang = -0.1)
finally:
grdevices.dev_off()
grdevices.png(file="mma9rpy2-2.png", width = 512, height = 512)
try:
r.heatmap(mdata)
finally:
grdevices.dev_off()
Final results:

... and a heatmap plot:
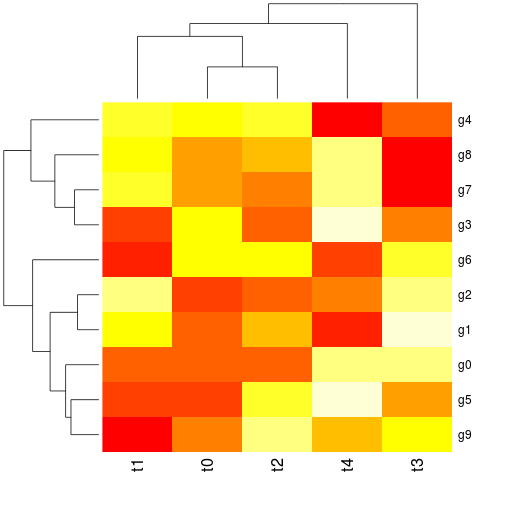
Final note, yes I know there is some fuzz at the bottom of the image with the dendrogram. I don't know why. Maybe someone can fix this ... and yes, that's possible, because all of this is fully open-sourced :-)
td;dr: https://gist.github.com/4176508
Thanks, very interesting post, a definite food for thought. RPy seems to have achieved a remarkable level of mapping R language constructs on Python language constructs. Mathematica does not directly support OO, and is based on immutable expressions, which are some reasons why it is perhaps not so easy to achieve that in Mathematica. I also agree that string escaping is a mess.
ReplyDeleteThe behavior of RSet which injects the variable into R'w workspace and does not bind it directly to some variable in Mathematica workspace is quite intentional. R objects mix state and immutability in rather interesting way IMO, and we picked the immutability part, to have transparent mapping between R expressions and Mathematica expressions (since Mathematica is expression-based and expressions are immutable). This approach is idiomatic for Mathematica, and has both strengths and weaknesses.
One serious weakness (at the moment) is that we can not yet write RLink code mostly as Mathematica code (similar to how you sript R in Python in your post) and have to resort to strings of R code, but in Mathematica it is fairly easy to create DSLs(due to its symbolic nature), so I think that this could be improved in the future. OTOH, it is fairly easy / automatic to translate complex (nested) Mathematoca expressions to the corresponding R objects, and it is done transparently to the user - which can be beneicial in some cases.
The other thing is that RLink currently only provides a fairly basic support for the core R language constructs, which has not been extended to the R library. This will probably change in the future.
In any case, I will be definitely studying RPy, it seems like it has many lessons to teach. Disclosure: I am the developer of RLink.
Hi, wow, I didn't expect to get a feedback directly from "the source"! :)
ReplyDeleteI'm aware that MMA has a different model for it's language, which has its own strengths and weaknesses. R is just a bit closer to Python, that's why it seems more natural to me.
About the mutability, does this refer to the slot assignment done in the block of strings? I've updated my posting slightly with a way how this is done via Python. Basically, a special assignment function just does what happens inside the string. Also, R's "list" can be referred directly and "paste" replaced by Python's list comprehensions ... but one has to map this list of strings to a proper R expression, though.
http://rpy.sourceforge.net/rpy2/doc-2.1/html/rinterface.html#pass-by-value-paradigm
(I haven't studied rpy2 very deeply, maybe this "low-level" approach is somewhere wrapped into something more "high-level", i don't know)
Well, I was searching the web for some reaction on Mathematica - R integration,and found your nice post (which I was lucky to have found since it reminded me about RPy and that it's a good idea to study it) :)
ReplyDeleteAs for the slot assignments: actually RLink currently does not provide the low-level interface needed to make slot assigments. It may be a good idea to add that in the future, since this is obviously a limitation of how low one can go. OTOH, it is not clear to me whether this won't be an overkill given that Mathematica is extremely high-level. It may happen that there won't be many productive uses of such lower-level API, either because it will not be possible to make it fast enough on the Mathematica side, or for some other reasons.
Right now, RLink is built on top of JLink, which is Mathematica interface to Java. JLink is very cool, but there is a very significant overhead in method calls. If a large amount of data is transferred at once (so that the number of method calls is minimized), this is less of an issue. But in all other cases, performance becomes a major factor. I don't yet know how RPy interacts with R, but if it loads dynamic R libraries directly into its process (which would be a logical thing to expect), then it can be way more efficient in data transfer and function calls. And Mathematica can not do the same, just because of the licensing issue - R is GPL (technologically, it should be possible, since Mathematica since version 8 has the LibraryLink interface to load dynamic libraries directly into the kernel process).
[I was pointed here by one of your readers - may be there are points I can clarify]
ReplyDeleteThe link to the rpy2 documentation points to the 2.1.x series. 2.3.0 is ready for release (been beta for some time - seem to work well for most people). Try instead:
http://rpy.sourceforge.net/rpy2/doc-2.3/html/rinterface.html#pass-by-value-paradigm
Rpy2 is using an embedded R, and is able to expose the data in R to Python without copies. As a result accessing R data through rpy2 can be faster than accessing them through R itself. If higher-level protocols are required (say Thrift or else), chances are that there is already a Python package that implements it.
The bottom of the dendrogram is looking bad because the R function will try to deparse the variables in the function and print it. Here this is an anonymous variable from the R side, so the string ends up as the full structure of the object. A workaround is to bind the variable to an R symbol and use that in the call. I have thought of ways to make it automagic for the Python user but did not find the time to implement it.
Finally, creating list in rpy2 does not have to be that complicated. Try:
import rpy2.robjects as ro
l = ro.ListVector({'a': 1, 'b': 2}